During Chrome Dev Summit 2020 (held on Dec 9-10, 2020), Google Webmaster Trends Analyst John Mueller outlined three main elements of a good SEO strategy:
- Relevant and high-quality content: Users go to Google for relevant information. Your content must not only match what the users are looking for but also be well written. So, making your content high-quality and highly relevant to what the users search will definitely help your page ranking in SERP (Search Engine Results Pages).
- Content accessible to Google bots: Your content must not only be written for humans but also Google bots (a.k.a on-page optimization). if Google bots can’t understand your content and the content was inaccessible to them, it’ll be difficult for them to recommend it in SERP.
- Good SEO signals: Contrary to popular belief, a Good SEO signal wasn’t how many backlinks, or page authority you have. Believe it or not, that’s more on content relevancy than good SEO signals. What “good SEO signals” actually means is providing a great page experience to the users, which consists of how quick a page load, its mobile-friendliness, and of course, Core Web Vitals.
Table of Contents
Why are Core Web Vitals Important?
Starting from May 2021, Google will introduce new search algorithm updates, and incorporate Core Web Vitals as part of their search ranking factors.
This new search algorithm update will rank websites based on their page experience and their user-friendliness, instead of just on keyword density, backlinks, or page authority.
The idea behind this is to improve user experience and search result quality so that users will find the right content faster on their mobile devices/websites.
So, Having high-quality & relevant content alone will no longer be enough to get your web page to rank high in SERP (Search Engine Results Pages).
We also need to make sure that the user has a great experience while viewing the content.
In the past, we might be able to get away with slow loading, and poorly-optimized web pages as long as we have good content, but not anymore.
Once Core Web Vitals is implemented, Google will penalize any slow web pages (this includes the loading speed as well as the responsiveness), and give ways to web pages that load fast, and have a great page experience.
What are Core Web Vitals, and what do they measure?
Core Web Vitals represents the elements that Google uses to calculate how well does a website provide a good page experience to the users.
This includes:
- How fast a web page is loaded?
- How interactivity a web page is?
- How stable are the visual elements in a web page?
Specifically, Core Web Vitals measures user experience in following metrics:
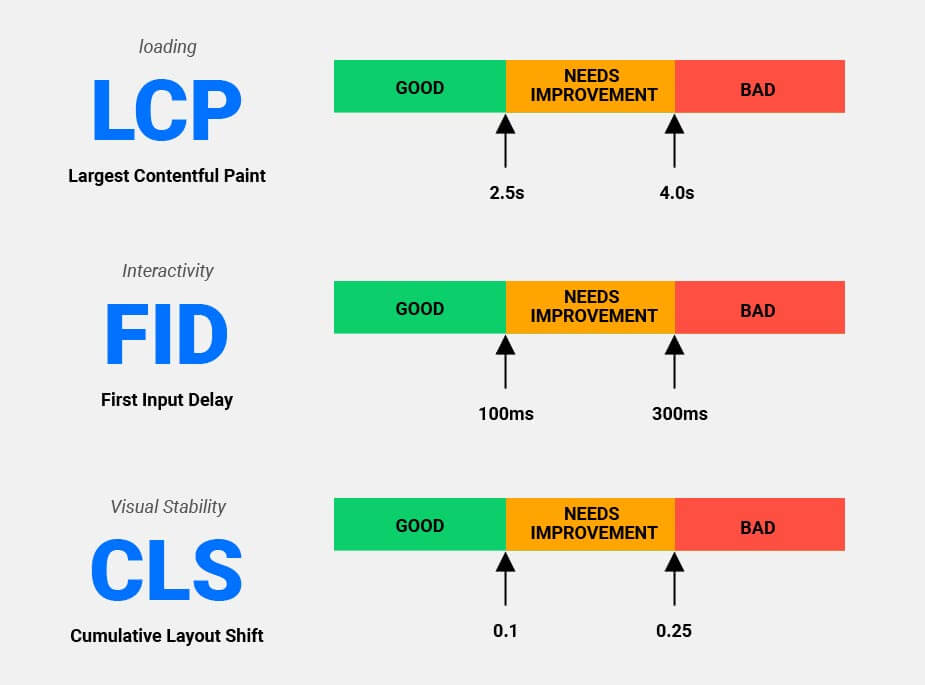
All three metrics are important parts of the page experience.
Largest Contentful Paint (LCP)
This metric measure how fast your website served “Above The Fold” content to the users because this would affect their first impression of your website and how fast they can start using your website.
“Above The Fold” content represent the website content your users can see without having to scroll down.
In WordPress, the most common “Above The Fold” content is the “Hero” section in your home page, the featured images of your post, or the header image of your blog.
Here’s an example of an “Above The Fold” & “Below The Fold” content of a web page:
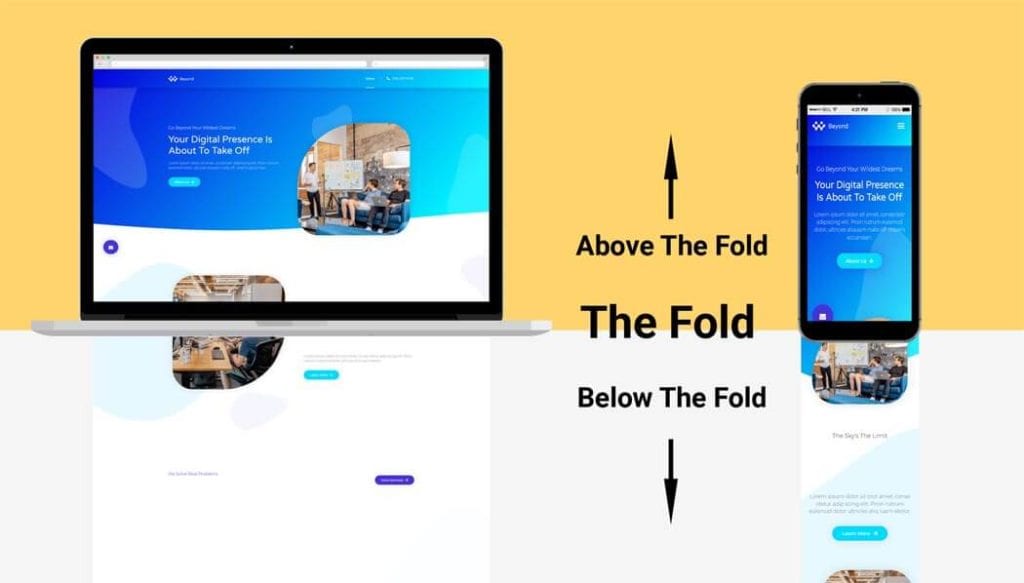
Anything that appears on the computer / mobile screen without scrolling is considered “Above The Fold”.
Why Largest Contentful Paint (LCP) is Important to Track
Back in 2016, Google conducted research that shows over 53% of users will leave a website if it takes longer than 3 seconds to load.
Amazon discovered that every 0.1-second increase in loading time would result in 1% of sales loss.
If you’re a blogger, an online store owner, a business owner who uses WordPress to create the website for your business, then you should be concerned about such matters.
Because your website is the only way to get visitors and customers.
So when Google says the slow website will affect your website’s ranking in SERP, that means it is directly affecting your SEO efforts in getting more people/visitors and customers.
The average website load time on a mobile device is between 10 – 22 seconds.
Yet, most users expect a website on a mobile device is loaded as fast as their desktop counterpart.
With the fast-paced world, we live in today, needless to say, nobody has the patience to wait for a website to fully loaded anymore.
They will just click away to another website.
That’s why we need to focus on improving our website loading speed to make sure our website load fast on all devices.
Now that we know users want a website to load quickly, and we’re committed to making sure of that.
Luckily, we don’t have to load the whole website in under 3 seconds.
As long as we can serve our “Above The Fold” content to the users in under 2.5 seconds, we’re good to go.
Note: 2.5 seconds rule is for mobile devices only. For desktop or laptop, your Above the Fold content or LCP must be loaded in 1.2 seconds.
You may be thinking that it shouldn’t be hard to serve Above The Fold content under 2.5 seconds, right?
Given that we only need to load the top portion of a website within 2.5 seconds, and don’t have to worry about the rest of it, theoretically, this should be easy to accomplish, right?
Well, it’s actually a lot more complicated than that, especially for a WordPress website.
Here’s the process of how browser loads a website in mobile device:

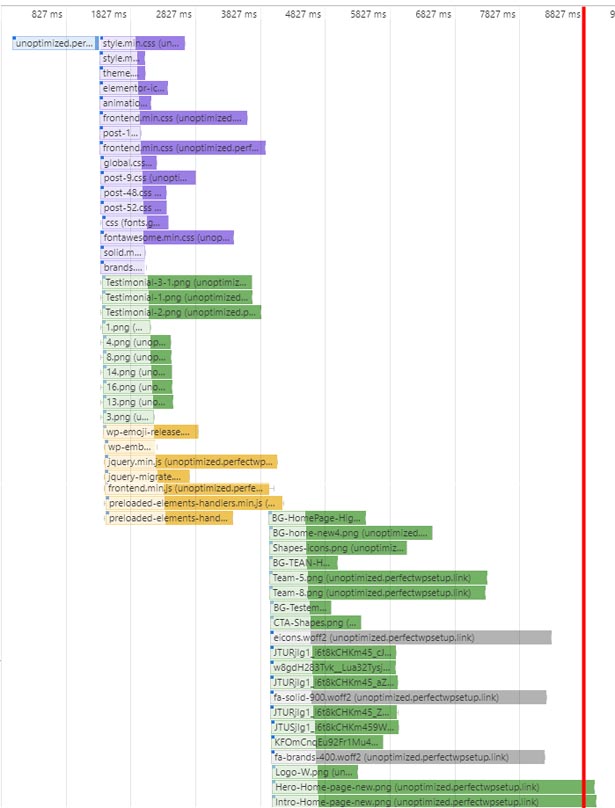
The red line represents the moment when “Above The Fold” content has been fully loaded.
To achieve this, the browser needs to wait for the initial response from the server, then load all the CSS files, all JavaScript files, all the fonts & icons, and finally the images.
This results in the slow rendering of the website, as the browser had to wait until all of the HTML, CSS, fonts required to render “Above The Fold” content has been processed, and all JavaScript has been loaded and executed.
The more resources a web page has, the longer it takes for the browser to paint the “Above The Fold” content.
This means that the website takes longer for a user to interact with it.
Considered the number of files the browser needs to load first before it can serve the content to the user, no wonder most WordPress websites take so long to be fully loaded.
3 Main Reasons Why Your WordPress Site have Poor LCP Score
In hindsight, here are a few reasons why WordPress websites are slow in rendering content, which will result in a lower LCP score:
Reason #1: Slow server response
This is probably the most common reason why a WordPress website loads slowly.
The website owner might have signed up with a shared hosting-provider that’s too cheap and offer limited resources. This means fewer resources, less RAM, slower CPU, and slower network connection.
Other than that, the server could be overloaded due to traffic that’s not being managed properly.
This results in slow response time from the server to the web browser, which affects page load time and increases load time exponentially for every following page visited by users.
Reason #2: Too many web assets are being loaded
WordPress websites are complex systems that require a lot of resources.
When plenty of images, scripts, stylesheets, and other assets are being loaded on the page at once, it can take a longer time to paint all the content that will be visible on the screen.
The best way to tackle this issue is by optimizing web assets and reduce their number to be loaded on a single page.
Reason #3: Contents that required JavaScript to render
While we know that JavaScript is essential to building rich user experiences, it also plays a central role in how fast web pages render on today’s web pages.
JavaScript was originally designed to execute as a separate task from the rendering of the page itself. But JS’s modular nature allows it to control the flow of a page’s content, dynamically loading and unloading sections of the page and re-rendering them as needed.
One of the examples is how slider plugins are being used on many websites.
Most of them use a lot of JavaScript to load all the images and other assets that will make up the slider on a single page load.
This results in a very slow loading time for the web page, as the browser needs to wait until all of the assets (CSS, JS, images) have been loaded before it can render the slider.
And that’s just one example of how JavaScript can affect page load time.
Now – I’m not saying JavaScript is bad.
But, web pages take longer to load when a lot of data needs to be retrieved, and processed.
This can cause frustration to the users who want to see your page immediately and make them abandon the website entirely.
Using JavaScript to dynamically load content is great, but it can slow down web pages significantly if not handled properly.
This is why we need to have a good balance between JavaScript and CSS because loading too much JS will make your web page much slower.
In summary, to optimize your website’s Core Web Vitals LCP score, you have to make sure that:
- Your server is not overloaded, and able to respond quickly.
- Your website is optimized from the front-end perspective to reduce the number of web assets that are loaded on a page.
- Your website offers a good user experience by loading “Above The Fold” content in under 1.2 seconds for desktop/laptop, and under 2.5 seconds for a mobile device.
First Input Delay (FID)
This metric measures the time it takes for a user to interact with elements of your website.
Any action a user tries to perform on your page will be measured and recorded under this metric, which includes typing, moving the cursor, clicking on buttons, etc.
Here’s an example how the First Input Delay (FID) is being measured:

The user here clicked a button. The time it takes for the website to respond to this input action is considered FID.
The difference in response time between when the user tries to interact and when the browser can respond is a proxy for how “interactive” the page experience feels.
Why First Input Delay (FID) is Important to Track
You might be asking yourself why would I want to track how long it takes for my users to interact with my website? Don’t they just click on things anyway?
What’s the big deal about FID?
I’ll tell you why…
If you have high FID, it means that your website blocks your users for a long time before the browser can respond to their input.
This means that your web pages are slow to load, resulting in a delayed user experience.
Imagine if you’re using Google search, and it’s loading really slow. You try to click on a result, but there is an unexpected delay after each click you make.
That’s exactly how your website would feel like if your FID are high.
People are becoming more and more impatient with waiting for websites to load, so you need to make sure you’re not wasting time with a slow website.
If people aren’t interacting with your site, then they will leave and go somewhere else.
However, First Input Delay can only be collected if a user is interacting with the page.
This means that you need real-world data to determine if your website passed the FID metric.
Because of this, Google introduced a proxy for measuring First Input Delay called:
Total Blocking Time (TBT)
Total Blocking Time can simulate a similar user experience of First Input Delay, plus it can be measured with synthetic data under the lab environment.
TBT is calculated by summing up all the long tasks that need to be completed during page load.
Long tasks like :
- Network timeout.
- JavaScript execution and parsing.
- CSS style execution and parsing.
- Any other resource requests (XHR or sync).
When you aggregate all these tasks together, you get your Total Blocking Time (TBT).
Any performance problem that results in a user having to wait longer for your page content to load will contribute to TBT as users are blocked from interacting with your website during this time.
Used together, First Input Delay and Blocking Time are the signals of how interactive a website is.
If the website has exceptionally slow page performance, then it will be more likely that it will have higher TBT, which demonstrates how delayed the page response is to user input.
Lab Data vs Field Data
I need to emphasize that TBT is just a proxy for you to determine FID under lab conditions.
The real FID data can only be collected under real-world conditions because it’s the actual time when a user interacts with your website to give you feedback.
Since FID can’t be collected from lab testing, it’s important to complement lab testing with field testing too.
This will help you understand how real users interact with your website, and if they’re experiencing any performance issues that might prevent them from interacting with your site.
Note: You can use this plugin to send Core Web Vitals data from your website to Google Analytics so that you can track it from there, and make changes accordingly. However, at this moment, it would only apply to users who are using the Chrome browser.
Just keep in mind that TBT is just a proxy for First Input Delay, and it shouldn’t be used as an absolute for determining if you passed the FID threshold or not.
Cumulative Layout Shift (CLS)
This metric is another core web vitals way to measure user experience. It measures how often the page layout shift during initial page load, or any changes triggered by JavaScript.
There are two types of Layout Shift:
- Content-determined Layout Shift
- JavaScript-determined Layout Shift
Let’s explain each one of them in more detail.
Content-determined Layout Shift
Content-determined Layout Shift happens when content is added or changed on the page, and the page layout has to change for the content to fit into view.
This type of Layout Shift is more likely to happen when content is dynamically loaded or changed.
For example: If there is an image on the page, the browser will have to adjust the page layout to display the image where it is supposed to be.

However, images are not the only things that can trigger Content-determined Layout Shift. For example:
- Banner ads, AdSense snippet, or anything else that adjust their size when they display on the page.
- Fonts and code font size change too (e.g., embedded font files).
JavaScript-determined Layout Shift
Javascript-determined Layout Shift happens when JavaScript is used to change the page layout itself.
For example: image carousel that changes height as it goes around, masonry grid that pushing and pulling content around, or any other animation effect that changes the layout of your page.

The reason why these two kinds of Layout Shift are considered “bad” is that it confuses users who are trying to navigate through a website quickly.
Why Cumulative Layout Shift (CLS) is Important to Track
You might be wondering, if layouts are meant to change every once in a while, why would I want to track how much the layout changes?
Let me explain…
Imagine that you’re reading an article. And then on top of your article, you have an image carousel that’s loading up new images with different heights at different intervals.
Or imagine that you have banner ads that change their size whenever a new ad shows up.
Every time the height changes, it pushes or pulls the content below it, which either pushes your article down or pulls your article up.
That means you have to refocus on your article every time the layout changes.
Every time you have to refocus on your article is one less time for you to read the content and understand it.
Imagine if there are a lot of layout changes happening on every page load.
That means you’re going back and forth between reading and refocusing every time, making it difficult to keep up with what is going on on the page.
Therefore, It is very important to track cumulative layout shift because doing so will help us understand why and how our layouts are changing.
It will also reveal what page elements are causing a bad page experience to the users.
How to Measure Core Web Vitals using Chrome DevTools
Chrome DevTools can tell you everything you need to know about the performance of your website.
You can also find out whether your site is experiencing any serious issues that may affect its performance.
However, sometimes it’s hard to gauge the importance of some metrics that are only displayed in the Performance panel. This section will show you how to measure Core Web Vitals using Chrome DevTools and what they actually mean.
So – let’s get started!
- Open your website in Chrome browser Incognito mode, then press F12, or press Command + Option + J on Mac, or CTRL+SHIFT+I on Windows/Linux to open the Chrome DevTools.
Or, you can just right-click, and select the “Inspect” option.
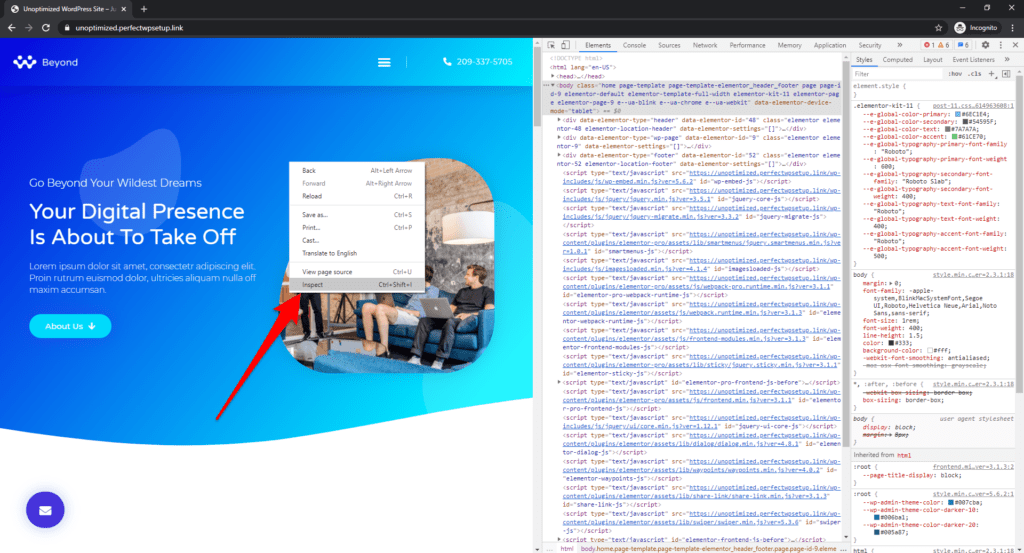
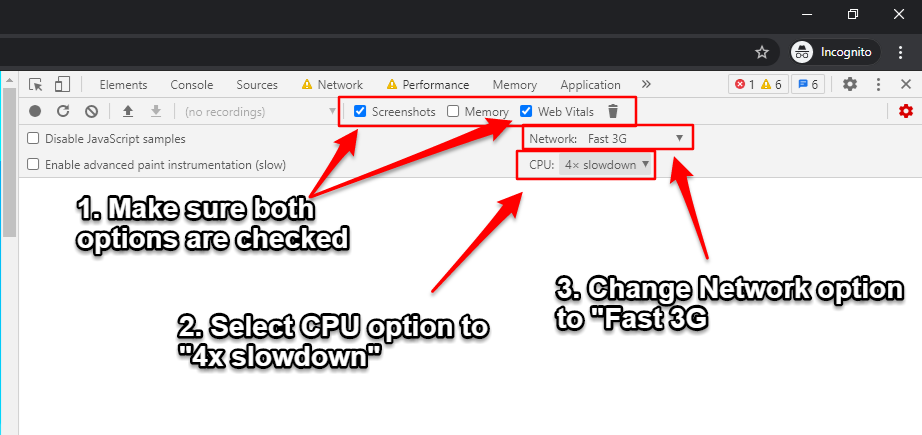
- Select the “Performance” tab, make sure both “Screenshot” and “Web Vitals” options are checked, then change “Network” to “Fast 3G”, and “CPU” to “4x slowdown”.
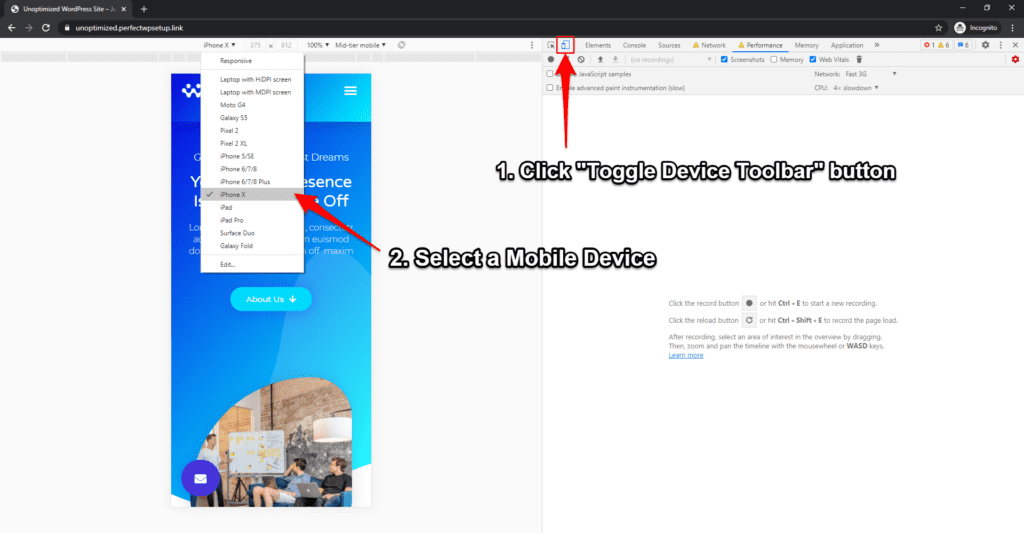
If you want to measure Core Web Vitals for Mobile devices, make sure you clicked the “Toggle Device Toolbar”, and select a mobile device to test:
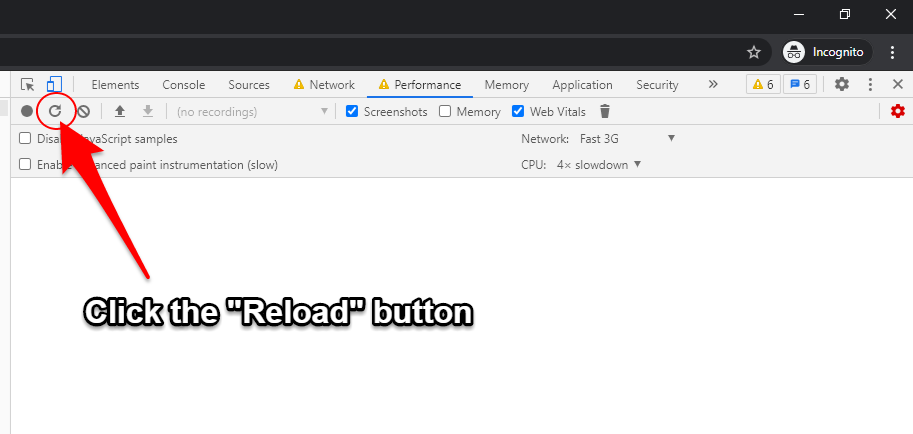
3. Click the “Reload” button to record the page load.
- Wait until the web page is fully loaded before click “Stop” to stop the profiling process.
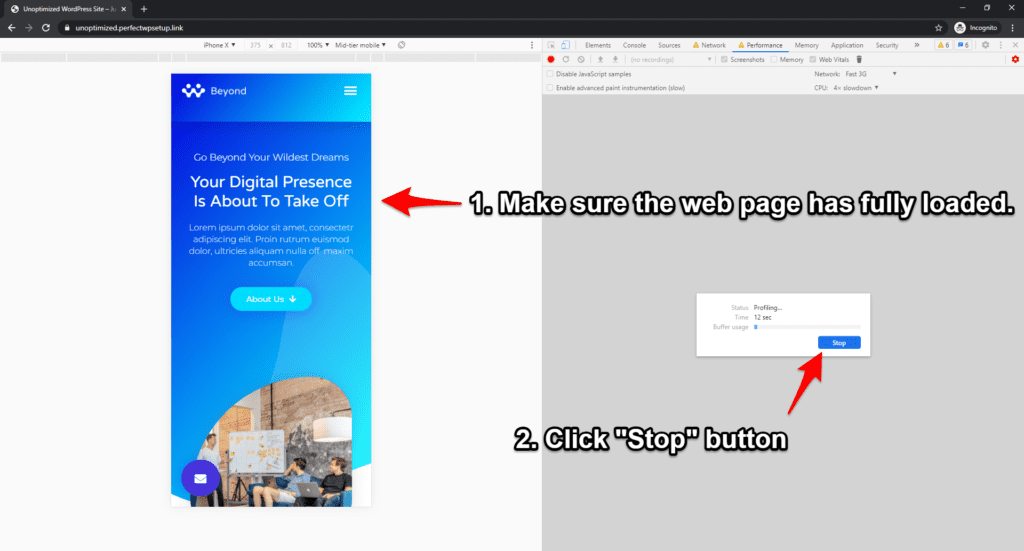
5. Once the profiling has been completed, you should see the results in the “Performance” tab.
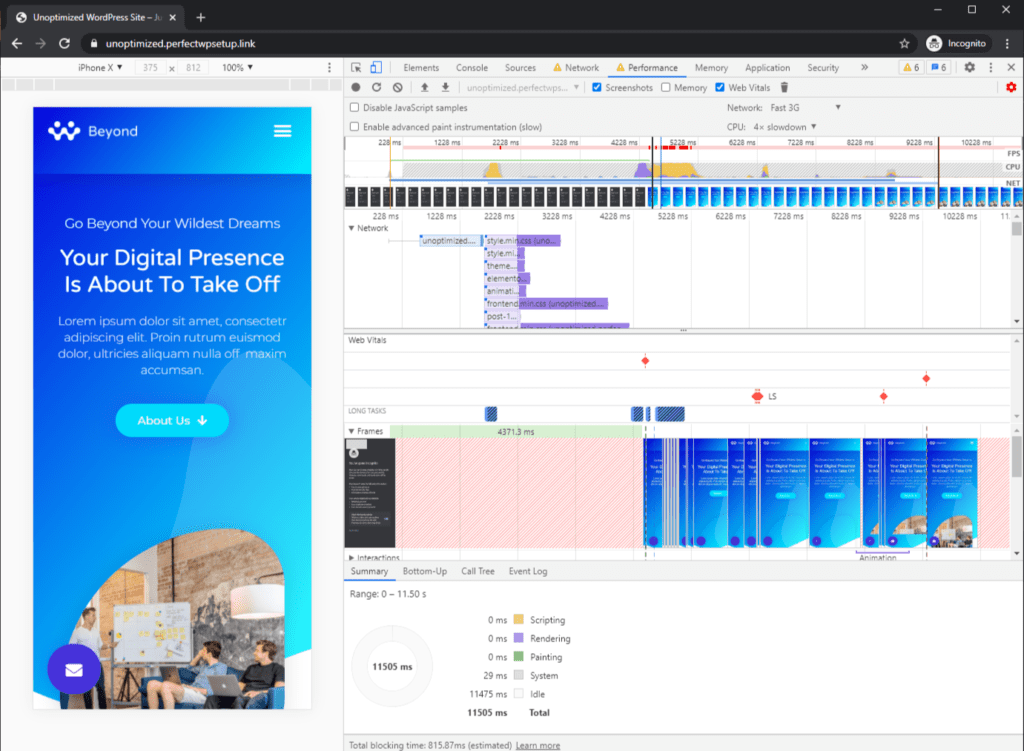
Let’s review the performance analysis one by one!
Frames section
If you hover over the Frames section, you should see the frame-by-frame screenshots of how the web page is loaded.
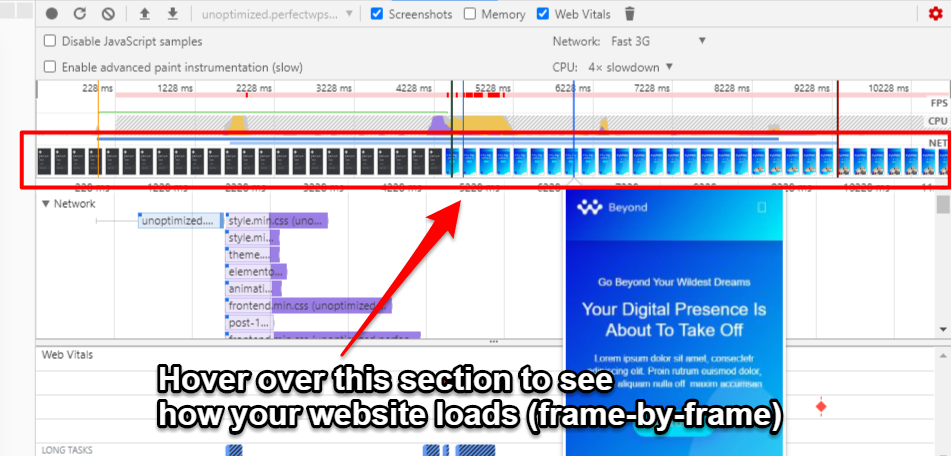
This section is particularly useful because it highlights how quick and efficiently, or slow and sluggish your web page is loading.
It will give you a clear indication of which components in your web page are slowing down the load time, as well as components that might have cause layout shift.
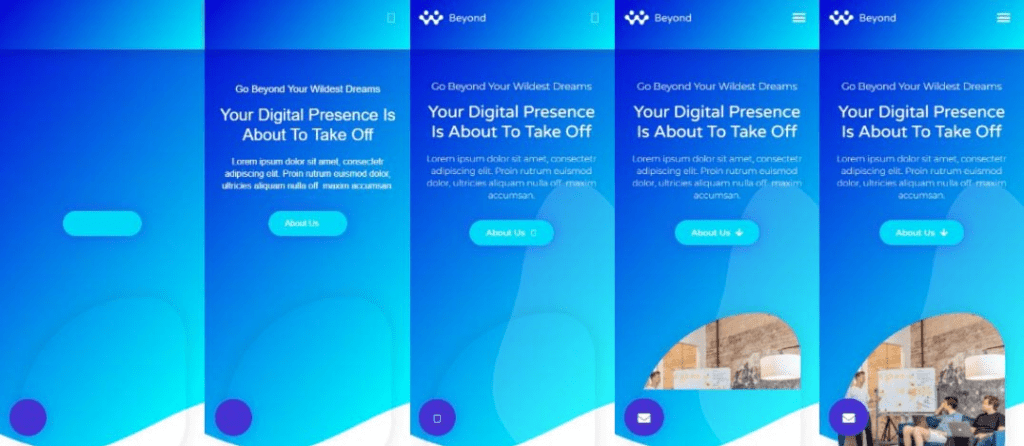
In the example above, you can see that the graphics and images on the webpage are making it load slowly.
Web Vitals Section
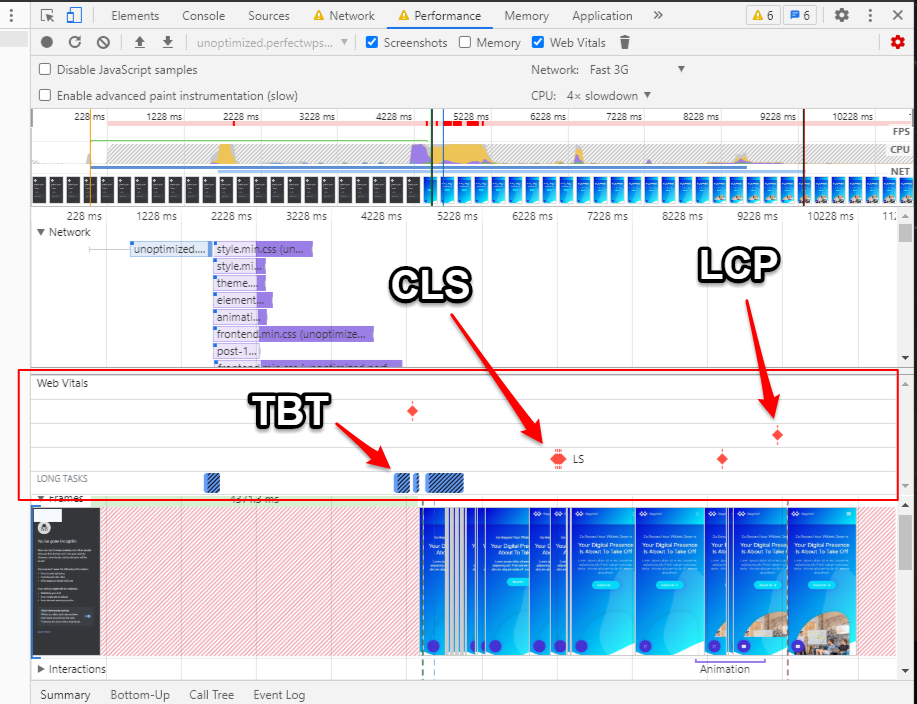
Under the Web Vitals section, you can identify 3 vital signs that should give you an indication of how optimized your website is:
- How fast does your page load the LCP elements.
- Are there any layout shifts on your page?
- The number of long tasks on the page that contributes to the Total Blocking Time (TBT).
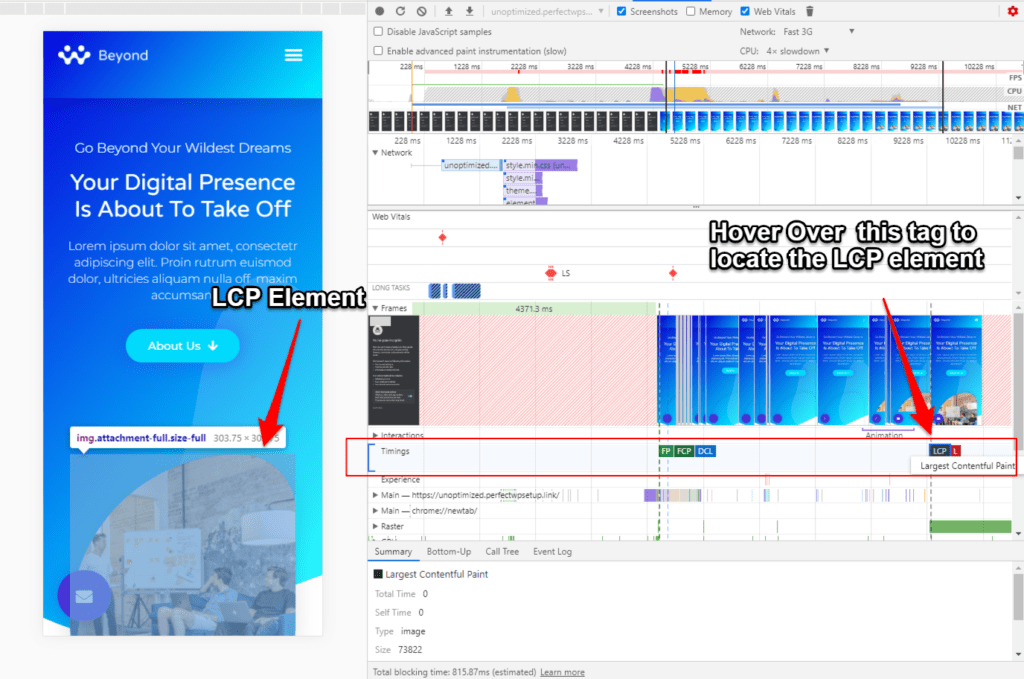
Timings Section
Under the Timings section, you can see the time taken for each section in your website to load. From First Paint (FP) to First Contentful Paint (FCP), to Largest Contentful Paint (LCP).
If you hover over LCP tag, you should be able to locate the LCP element on your webpage.
Experience Section
Under the Experience section, you can identify the element that caused the shift in layout.
Simply click the red line to identify the element that created the layout shift:
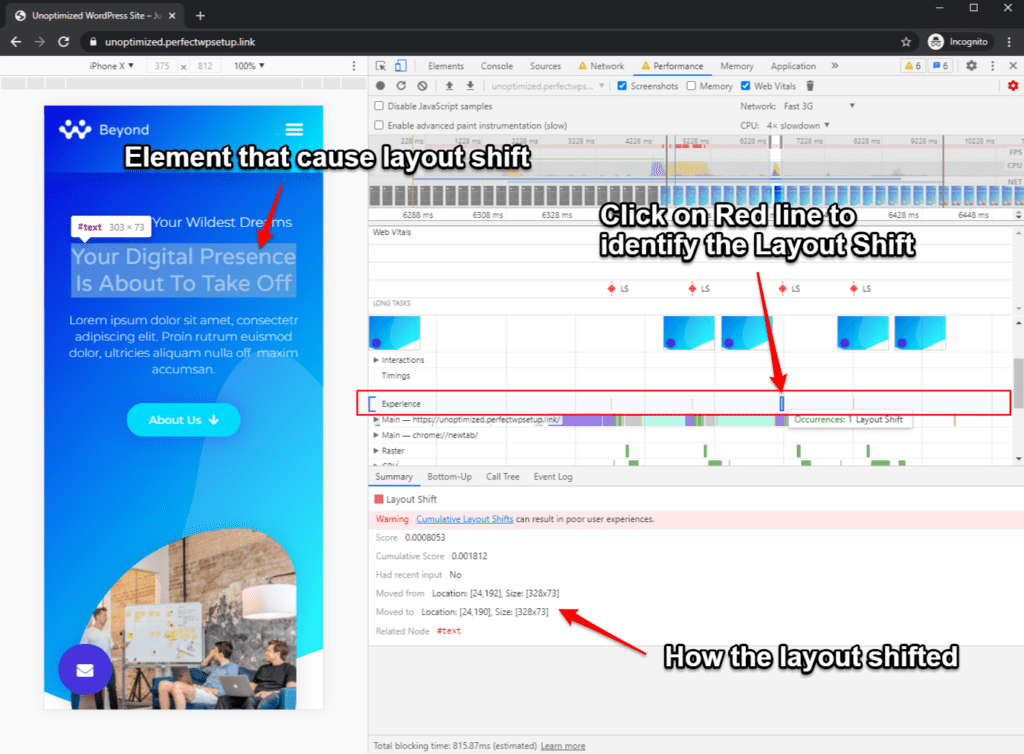
If you didn’t see any red lines in the Experience section, it means your page is consistent and there is no shift in layout.
Conclusion
Generally speaking, you should always focus on speeding up your website’s loading time, because it is the core foundation of any website.
However, To speed up your website’s page load time, it’s important to understand the impact that each web asset can cause on your website.
That way you can remove them, optimize them, or reduce the number of assets that are loading into your website.
The Core Web Vitals will help you understand how each asset is impacting your users.
It will also help you identify if any specific page elements are causing a bad user experience, and allow you to remove them or replace them with something else.
In the next part of this series, we’ll go through the actual tactics in how to optimize your WordPress website for Core Web Vitals.

